

Strategies for Effective Performance Management
A few strategic changes can significantly make a difference when managing your team or company’s performance. Here are some quick steps to better understand your practice’s performance and ways to measure its improvement.
5 Steps in the Performance Management Process
Use these simple processes to enhance your Performance Management: Measure, Monitor & Analyze:
- Define your goals and create a formal plan that is obtainable
- Set KPIs
- Gather baseline results
- Compare to industry benchmarks
- Monitor data
1. Define Goals to Create a Plan
Ask yourself these initial questions to jumpstart your process and to gain understanding of where you want your practice to be:
- What do we want to improve? Clearly state your mission, goals, and prioritize by your needs
- How are we going to accomplish these improvements? List out process changes
- Who can drive these performance improvements? Identify stakeholders that can affect change
- How are we going to track our progress? Identify Key Performance Indicators, create relevant ways to track your data (dashboards are one great example), analyze data, and find applicable benchmarks.
2. Set Your Key Performance Indicators – Scheduling, Productivity, Billing, Collections & A/R and Denials
How are you going to track your progress? When tracking, monitoring, and managing it is important to compare KPI results to goals on a daily, weekly, or monthly basis. Communicate results with the stakeholders, and offer assistance when needed.
Use these categories to help identify your KPIs and productivity factors:
Access: No Show Rates, Cancellation Rates, Bump Rates, Utilization Rates
Patient Flow: Average Wait Time, Total Appointment Time
Patient Visit Counts: New patients, Established patients, Unique patient count, RHC Qualified Visit Count, Average visits per workday, wRVU- Relative Value Units, Work Units
Denials: Total denial amount, Denial rate, Resolution rate, Write off rate
A/R: Total A/R Amount, A/R Percentage over 90 days, Days in AR, Payments per wRVU, Days to pay
Billing: Gross charges, Days to post, Days to bill, Claim count, Clean claim rates, Unbilled charges, Claims on hold
Collections: Payments, Adjustments, Contractual Adjustments, Non-contractual Adjustments, Expected, Payment ratios, Payments per visit
Clinical Quality Measures: Controlling high blood pressure, Diabetes A1C Poor Control, Documentation of Current Medications, BMI Screenings, Cancer Screenings, Colorectal Cancer Screening, Breast Cancer Screening, Cervical Cancer Screening,
3. Gather Baseline Results
After you’ve set your KPIs, preferably those that are month over month, you can easily start seeing trends in your performance. Are your days in AR too long? Why in one month are your denials rates higher compared to others? Maybe you find no-show rates are increasing. Regardless if the data is negative or positive, all information is good information. Once you know where to begin you can start altering your processes and begin making any necessary changes to create positive growth in your practice’s performance. Our VP of analytics always likes to quote Robert Kaplan from Harvard’s business school, “You can’t manage what you don’t measure.”
4. Compare to Industry Benchmarks
Benchmarking, in the end, is truly just setting a point of reference. Benchmarking can analyze and improve performance, help you gain market insights and internal practice insights, and it can identify your areas with opportunities for improvements while promoting accountability. Examine other businesses within your industry and see how they function, or what improvements they are using and compare their data to see how something similar could be adopted into your practices. Some sources for external benchmarking are sources like CMS, Specialty, or Industry Associations such as MGMA.
Internal benchmarking is also important if not more so than external. Internal benchmarks come from recorded data in past months/years. Have you improved? Are you trending up or down? Keep in mind seasonality! Your practice ultimately needs to know what, for example, a regular February or March might look like.
Many times when practices run initial benchmark comparisons they find that they’re below the 5oth or 20th percentile and that certain areas are below expectations. It’s easy to feel discouraged and disappointed, but remember that there’s room for improvement and there are always areas that could be turned around quickly!
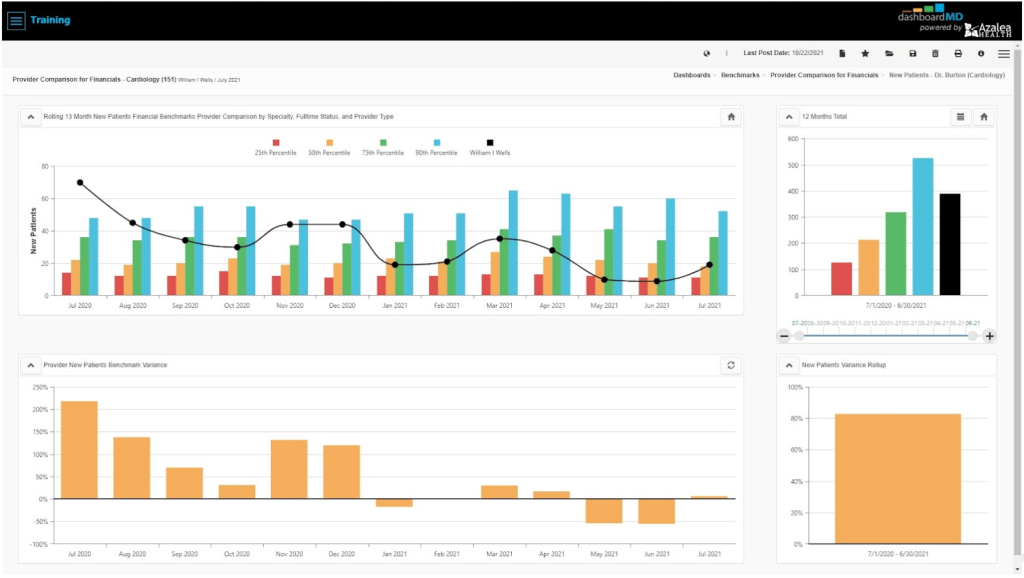
Below find a benchmarking dashboard provided by Azalea Analytics, powered by dashboardMD. The black line represents a particular doctor’s performance. The doctor here is being compared to 150 others in their field. Each colored bar represents a percentile. Blue is 90th, green 75th, yellow 50th, and red is the 25th percentile. With this benchmarking dashboard, we’re able to understand the highs and lows of not only the doctor but the practice and its seasonality as well.
Looking for more examples of benchmarking? Click here to download an ebook specifically on managing your AR, or visit our blog on 5 Tips to Enhance Your Revenue Cycle Management: Reporting, KPIs, and Benchmarking.
5. Monitor Data
Gather your baseline results from your chosen KPIs. Compare and analyze the results against initial expectations. This can show you where you need to be and what to focus on. Listening to stakeholders and discussing solutions to consider additional process improvements is also important when it comes to the stability and longevity of your company.