5 Tips to Enhance your Revenue Cycle- Reporting, KPIs, and Benchmarks
Reporting, KPIs, and Benchmarking
Many practices, clinics, and hospitals know that revenue cycle management is no small task-sometimes it’s a beast. With constantly changing requirements, regulations, and complex processes it can be difficult, but at the end of the day, and in this financial post-COVID environment, your revenue cycle management is your most important process. In this blog, we’ll give you helpful tips and tricks on how you can address the latest revenue challenges.
Trends in Revenue Cycle Management
According to an Azalea 2019 survey, top challenges organizations faced were declining reimbursements and unqualified staff, both of which still apply. But fast forward to today, practices are seeing decreased patient volumes, staff turnover, quick telehealth adoption, and adapting new COVID guidelines and requirements. Additionally, patient responsibility has skyrocketed- high deductible health plans are the norm. For example, 27% of all Azalea collections, (from our clients’ patients), came straight from their patients directly compared to the 5-10% of collections we saw in the early 2000s. On top of everything, as many of us already know, last year hospitals, clinics, and practices lost money and saw immediate patient decline. But there has not been a rubber band-like effect since then- patient visits are still lower than years prior and revenue has not bounced back.
On the positive side, clinical staff everywhere have learned a lot. In the past two years, many of us have grown as leaders and have risen to meet difficult challenges. Though revenue is a major concern, our organizations have grown in other ways- we’ve learned to adopt new technology and guidelines quickly, we’ve created emergency protocols, and updated our workflows. Patient portals and telehealth boomed. Analytics has quickly become a necessity.
Looking ahead at the new year providers and clinical staff should be proud of what they have accomplished and the impacts they continue to make. With that being said, it’s crucial practices and clinics continue to stay open, grow, and prosper.
A big theme of 2022 should be deconstructing your revenue cycle process. Revisit old practices and processes. Ask yourself, how do I get the most out of our software? How can I maximize my system? Is there room for improvement?
The most effective way to enhance your revenue cycle is to analyze your data, use KPIs, and compare your data to industry benchmarks. Consider adopting reporting and analytics software to create insightful dashboards and reports for you. There are a lot of options out there, but make sure to adopt one that’s healthcare friendly. Azalea recently integrated dashboardMD, a business intelligence reporting solution and healthcare analytic software that gives users daily access to integrated operational, financial, and clinical analytics.
Interested in dashboardMD?
Our recent acquisition of dashboardMD now offers providers the opportunity to receive intuitive and actionable healthcare analytics straight from our Azalea platform! dashboardMD is a scalable solution that was developed to give physicians not only more insight into their practice but to minimize time on reporting, increase revenue, and eliminate gaps in care. The web-based solution offers multiple business performance management tools like KPI benchmarking, pre-built and calculated reports, and customized dashboards, all while needing minimal training to get started.
Learn quick and easy ways to enhance your collection process and increase practice reimbursements.
5 Tips to Change the Way You Analyze Data
1. Create Leading Indicators
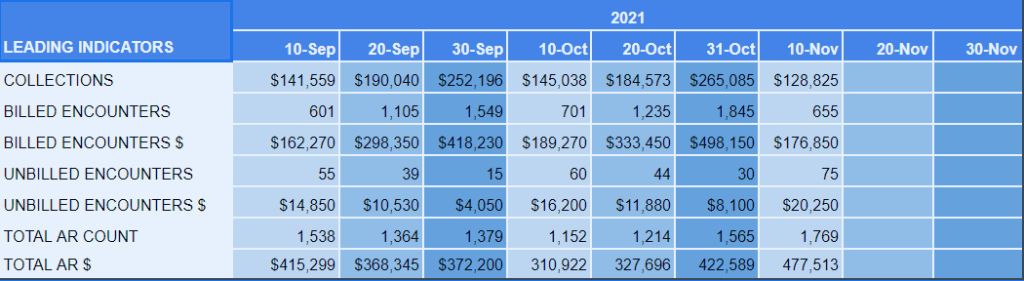
Leading indicators are probably one of the least used KPIs, but one of our favorites. The purpose of a leading indicator is to track selected data at certain intervals so that you can get ahead of your claims, revenue, and so forth. If you don’t have some sort of routine indicator, for example, at the end of the month you might run reports and find out that you haven’t collected as much money or not enough claims have been filed. This can come as quite a shock to those who are unprepared. We recommend keeping leading indicators very simple. Build your own dashboard if you don’t have an analytic software like dashboardMD. Set a ‘check-in’ date within the middle of the month and record it so that you can consistently compare to previous months, calculate variances or forecast future months. Take a look at our dashboard as an example.
2. Build KPI Dashboards
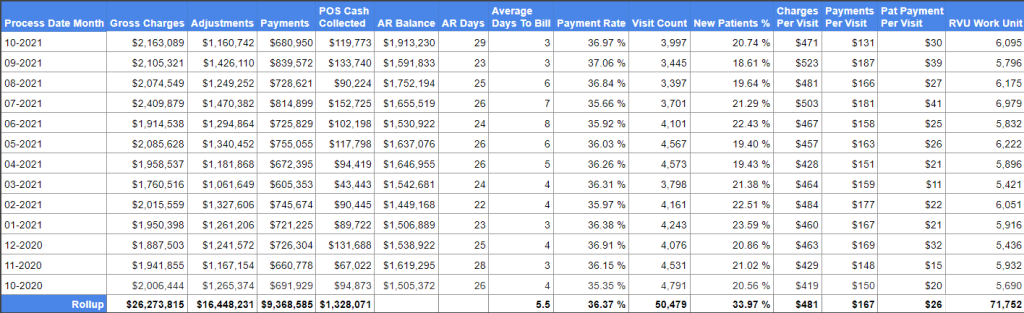
Below we have an example of a 13-month custom KPI dashboard. Here you can see seasonality, gross charges, collected, total AR, and days in AR. Again if you do not have access to an analytics tool like dashboardMD, you can build your own dashboard.
From this dashboard you can calculate multiple formulas. For example:
- Payment Rate- Gross charges divided by total payments
- Charges Per Visit- Gross charges divided by visit count
- Payments Per Visit- Payments divided by visit count
The next step we recommend, after building your initial KPI dashboard, is to build multiple tables for different providers at multiple locations. If for example, in the previous 13 month chart, you find that days in AR are getting out of control or your average days to bill has spiked, these extra dashboards can help identify if it’s a certain location or provider that is taking longer to get claims out the door or isn’t coding properly etc.
22 Tips & Tricks to Increase Practice Reimbursements
Ask yourself: Are we consistently collecting patient co-pays? Are our patients paying on time? Are more than 4% of our claims being rejected? Do we have a monthly period close process? If you can’t answer “yes” to all of these questions, this list is for you!
Learn quick and easy ways to enhance your collection process and increase practice reimbursements
3. Use POS Collections and Claims Benchmarks
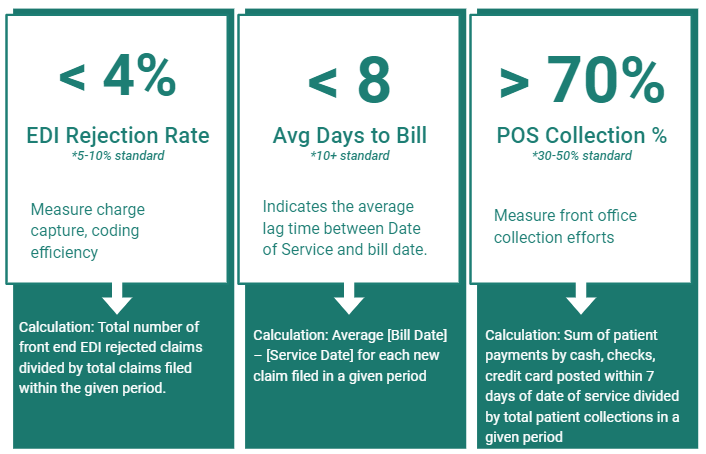
We know your goal is to send claims as quickly as you can to keep cash flowing. There are three calculations that we like to use: EDI rejection rate, avg days to bill, and POS collections percentage. With these three calculations, you can accurately understand front-end efficiency.
Calculate your EDI rejection rate by taking the total number of front end EDI rejections divided by total claims filed within the given period. A 5-10% rate is standard but if you can keep it below 4% that’s best. Your EDI rejection rate will measure your charge capture and coding efficiency.
Calculate your average days to bill by taking the average bill date minus the service date for each new claim filed in a given period. 10 days is the standard but keeping it below 8 days is best. Your average will tell you the lag time between your date of service and bill date.
Calculate your POS collection percentage by taking your sum of patient payments by cash, checks, credit card posted within 7 days of service and divide it by total patient collections in a given period. The standard is between 30 and 50%, but greater than 70% is ideal. Your POS percentage will measure your front office calculation efforts. The end goal here is to rely as much as you can on your front end for cash flow and not your back end invoicing.
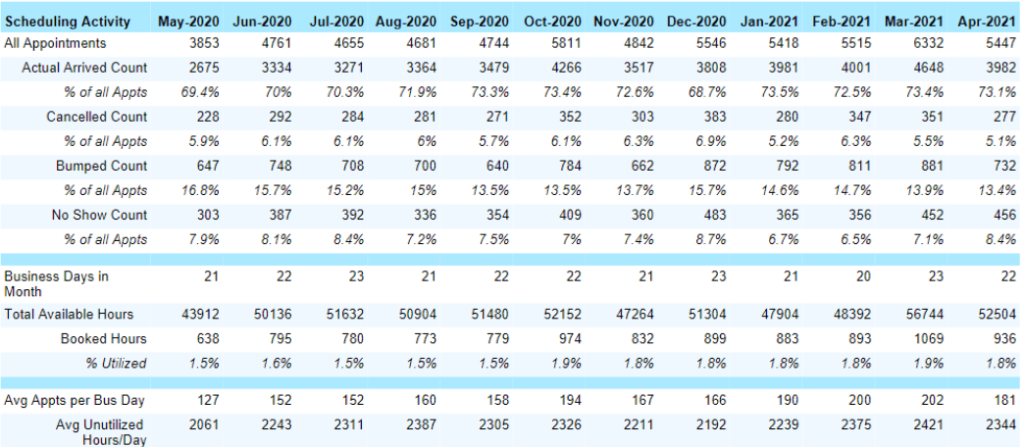
4. Utilize Appointment Scheduling Benchmarks
This benchmark shows us how efficient we are with scheduling and our availability and utilization rates. The chart and data below comes from dashboardMD. It takes all of our appointments for a given period of time and breaks it down; how many patients arrive, how many didn’t show, how many rescheduled.
In order for this chart to ‘work,’ staff need to be logging patient arrivals properly, flagging patients and checking them in correctly. If there is concern about the validity of the data, this might be a great time to retrain staff on scheduling.
If you’re a growing practice and are trying to figure out how many more patients or providers you could take on or need, you can calculate that based on this chart. Look at how many available business days are available in the month, how many open time slots are there on provider’s schedules and how many were actually filled.
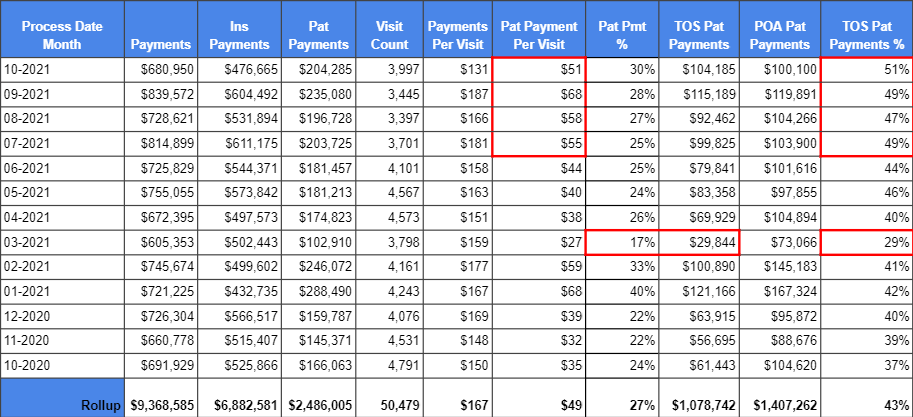
5. Monitor Time of Service Collections
This is going back to the 13 month model, seen below. If you track patient payment for visits, you will be able to see if it’s getting better or worse. If you compare this with POS you can track how efficient your front end is. You might find yourself wanting to break down and analyze this data. Ask yourself, how are you determining patient out-of-pocket amounts? How are you asking for payment? Do you need to retrain staff on certain collection processes? Depending on your specialty, 20-40% of your collections come from patients, and if you don’t have a good process, it’ll heavily affect your bottom line.
As an example, shown in the chart are some outliers bolded in red. We appear to be getting better at patient payment per visit, this could indicate a new process implemented or maybe employees are doing a better job of collecting upfront. What’s great about utilizing a chart like this is that we are able to see that we’re making improvements, but not quite where we want to be.