
RVUs Made Easy: What are Relative Value Units and How Can They Help My Practice?
Table of Contents
- What are RVUs?
- Intro to RVUs including History, RVU Formulas, and CMS applications
- Applications of RVUs in a practice setting
- High Performance Internal Medicine Practice with 4 physicians
- Advanced Analysis Exercises in Productivity, Cost, Payment, and Payer Contracts
- Using wRVUs for an Incentive Bonus Plan
- Pros and cons of using wRVUs as part of a comp bonus model
- Resources, Links, and Formulas
- How to use RVU Calculator in 2022
What are RVUs? (Relative Value Units)
RVUs stand for Relative Value Units. But what does that really mean when talking about healthcare? RVUs are non-monetary units of measure that model the value of healthcare services and relative differences in resources ‘consumed’ when providing procedures or services. RVUs are units that measure the value of a practice’s services. These values are assigned CPT (Current Procedural Terminology) codes, and with these numbers, we get an objective and statistically valid measurement of clinic activity, efficiency, and even cost- all to learn more about our providers and the practice as a whole.
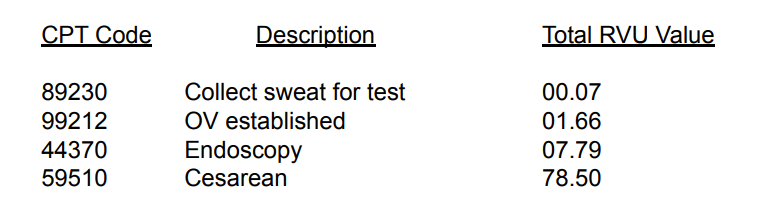
In its rawest definition, they are numbers between 0.07-366.87. The codes get gradually higher as the difficulty of the service increases. Below are some common examples. You can see that something as simple as collecting sweat for a test is only at 0.07 RVUs, but a Cesarean is significantly higher at 78.50 RVUs.
Where are these RVU codes?
Find access to all RVU codes at CMS.gov. Note, when you land on the page you will see that RVUs are marked by year. RVU codes change yearly, so always make sure you are up to date. When you select the year, you will be prompted to download a zip file.
A Brief History of RVUs
In the mid-1970s, and early 80s, Medicare reimbursements were based on Customary, Prevailing, and Reasonable charges, at the time were called CPR. CMS was contracted with the Harvard Group to develop the Resource-Based Relative Value Scale, RBRVS, which was put in place in January of 1992. It is still the industry standard today for benchmarking and measurement, and every year these codes are updated.
RBRVS took many years to complete, with guidance from over 200 physicians broken out into 33 specialty groups. The result of their findings was a table of values, for each CPT code, representing their work and services, categorized by both time and intensity (with intensity including mental efforts, clinical judgment, technical skill, physical efforts, and stress-related to risk). The values were designed to be “relative”.
The anchor code, or original code of the entire RBRVS was 99213, an established patient office visit with face-to-face time lasting approximately 15 minutes. At the time, a 99213 was assigned a value of 1.0 (It has since changed).
Watch “RVUs Made Easy: What Are They and How Can They Help My Practice?”
Our VP of Data Analytics, Jose Valero, gave a talk last December on RVUs! This session is packed with great information for all levels, whether you’re brand new to RVUs or a seasoned analyst. We’ll begin by introducing RVUs, simplifying their formulas, and highlighting how they can be leveraged by your practice. The session will conclude with a discussion on the benefits of compensation bonus plans based on Work RVUs and how they drive performance improvements in productivity and profitability.
RVU Formulas
RVUs are divided into 4 components:
- Physician Work – wRVU (References time and effort of the procedure)
- Practice Expense – peRVU (Estimate of what the expense is to provide procedure)
- Malpractice Risk – mpRVU (Cost for malpractice insurance. For example, it’ very different from Obs to family practice)
- Total RVU = wRVU + peRVU + mpRVU
As a reminder, these numbers are already calculated for you! All you have to do is pull them from the list.
The GPCI (Geographic Practice Cost Index)
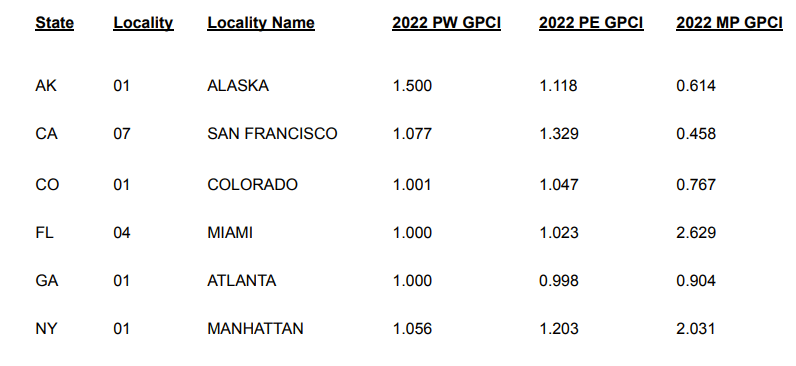
The only other variance to keep in mind is the Geographic Value Changes. The Geographic Practice Cost Index – commonly named “Gypsy”, is a term CMS came up with to address large variances of practice costs based on their locations across the country. For example, procedures done in rural vs metropolitan areas will vary greatly in cost and effort. GPCI multiplier values for major geographical areas are broken out by Work, Practice Expense and Malpractice Risk. Reference the scale below. You can see that all the RVUs for Alaska need to be multiplied by 1.5 in order for it to be normalized with the rest of the country.
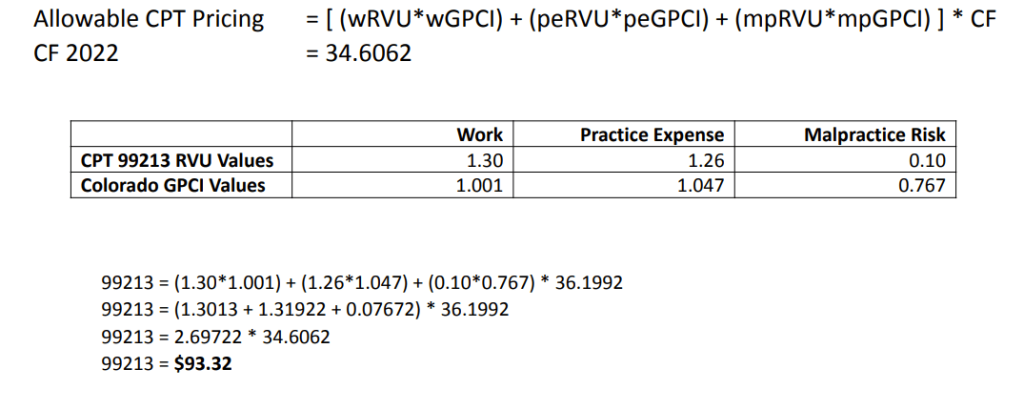
RVU Physician Fee Schedule Pricing
CMS uses RVUs to calculate the physician fee schedule and pays using the CF, or the Conversion Factor. They multiply the Total RVUs by the CF to calculate the allowable pricing. This year’s CF is $34.60
The complete formula for the RVU pricing is as follows:
[ ( wRVU* wGPCI) + ( peRVU*peGPCI) + (mpRVU*mpGPCI) ] * CF
You take your work RVU and multiply it by the GPCI, then add that to the practice expense RVU (which is multiplied by the GPCI). Lastly, add the malpractice RVU, which is also multiplied by the GPCI. Add the three results together, and finally multiply it by the Conversion Factor. At first glance, this is complicated, but in the end is straightforward.
Below is an example! We calculated a 99213 RVU code to find its pricing in Colorado.
While you may not be going in yourself and making these RVU calculations, we found it helpful to know how CMS calculates the pricing for each service.
Applications of RVUs
RVUs are mainly meant to understand performance, whether that’s for your practice or your physicians. RVUs are used to analyze practice revenue cycle areas such as productivity, cost, payments and payer contract reimbursements. wRVU, or Work RVUs, can be used for raises, new hires, contract negotiations, provider performance, benchmarking, practice performance, and more. There is a direct correlation between work effort, RVU values and revenue. Keep in mind, as you continue this application process, that some providers are part time, or their wRVUs vary by specialty, always make sure to normalize them when comparing RVUs.
Let’s dive into Work RVUs (wRVUs).
‘More work equals more RVUs, more RVUs means more revenue.’
You’ll need reports for the application of work RVUs. For example, take a full year’s worth of data. Here are some points you will need to include:
- Total visit counts by provider and per practice
- Totaled workRVU based on cpt codes
- Totaled payments
- Totaled total physician compensation
RVU Productivity Analysis: An Example
In this example, we have a well-established, fast-paced primary care practice with four top internal medicine docs in a city setting.
Let’s meet our fictional physicians:
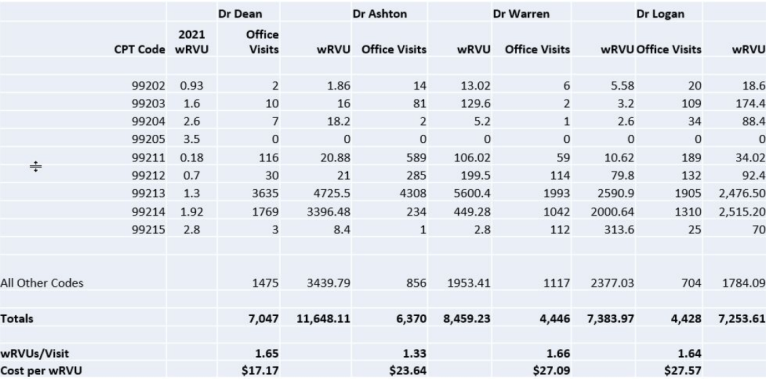
- Dr. Dean 90th Percentile Total wRVUs for 2021 = 11,648.11
- Dr. Ashton 80th Percentile Total wRVUs for 2021 = 8,459.23
- Dr. Warren 70th Percentile Total wRVUs for 2021 = 7,383.97
- Dr. Logan 70th Percentile Total wRVUs for 2021 = 7,253.61
Note that no matter what the wRVUs reveal in your practice, whether you are seeing high or low numbers, know that this is a great opportunity for improvement. The numbers above may not reflect yours, or maybe they do but don’t feel that you’re behind. Ideally, looking into these wRVUs by provider will help you gain actionable insights that can impact the business within the quarter or by the end year.
We built out the table below to dig further into the doctors. Each doctor is within the table and are broken out by their office visits, new patients and established, the corresponding volumes, and the corresponding RVUs. The first thing we did was calculate the RVUs per visit. We took the total RVUs and divided them by the number of visits. From that, we created a ratio, which you can see in bold along the bottom of the chart. The first ratio by Dr. Dean was a 1.65, but Dr. Ashton, as you can see is an outlier at 1.33, an immediate flag.
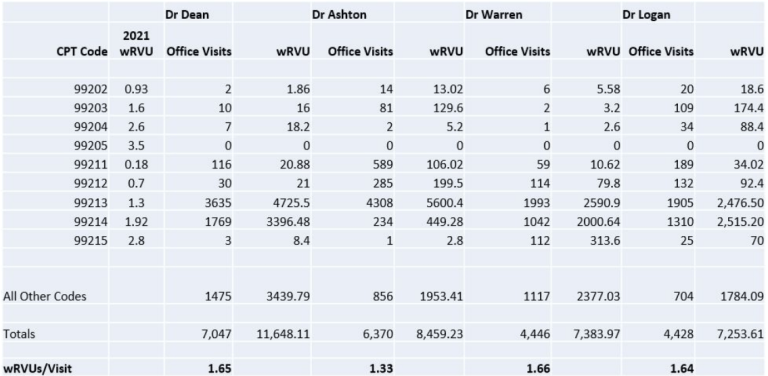
To break down why Dr. Ashton was significantly lower, we looked at the coding levels. He had lower established visits and new in-patient visits. What does this mean? There are two potential issues for the administrator to explore:
- Underutilization of Dr. Ashton
- Dr. Ashton is serving a high number of patients whose medical issues are less complex
This led us to pay closer attention to coding levels where we noted a huge focus on 99213 and a large focus on 99211- while a very light 99214 comparatively. The doctor may be under-coding visits and/or providing incomplete documentation which may be “leaving money on the table”. A chart audit should be conducted to see if Doctor Ashton is under coding.
Remember that this is all in the spirit of improvement! Maybe after an audit is done, we find that he is coding perfectly well and that his patients are just less complex (thus different wRVUs are applied). However, if we find that they’re coding at a lower level, maybe not including certain codes etc, there only needs to be a very easy adjustment on their part to create a significant increase in revenues.
Questions About RVUs?
RVUs can be a helpful tool to monitor your performance or the performance of a practice. Watch our webinar, presented by our VP of Data Analytics, Jose Valero. This session is packed with great information for all levels, whether you’re brand new to RVUs or a seasoned analyst. We’ll begin by introducing RVUs, simplifying their formulas, and highlighting how they can be leveraged by your practice. The session will conclude with a discussion on the benefits of compensation bonus plans based on Work RVUs and how they drive performance improvements in productivity and profitability.
Cost Analysis: The Setup
Taking this example a step further, let’s do a cost analysis.
On average, the salary or Yearly Comp of an Internal Medicine Physician is around $200,000.00 a year per physician (this may not be true for everyone, but is a nice round number to use for the sake of an example!). In this scenario, that would be $800,000.00 a year for ALL 4 physicians. We first calculated the cost per wRVU for the practice. We then took the total wRVU for the practice at 34, 744.92 and divided the $800,000 by the 34,744.92, equaling $23.02.
Now we have a sense of what it costs per work unit for that provider to work. To see it at the individual provider level, the setup is the same. Take their salary and divide by all their wRVUs. The breakdown in our scenario is as follows:
- Dr. Dean – $17.17 = $200K / 11,648.11
- Dr. Ashton – $23.64 = $200K / 8,459.23
- Dr. Warren – $27.09 = $200K / 7,383.97
- Dr. Logan – $27.57 = $200K / 7,253.61
Compared to the average of the practice, $23.02, you can see that Dr. Dean is well below, Dr. Ashton is right on point, and Dr. Warren and Dr. Logan are well above the average by a couple of dollars. Find below the updated data table with the associated costs.
Observations:
Dr. Warren and Dr. Logan were 4$ over. If you multiply it by all their wRVUs you’re looking at a pretty significant amount of money. All of this could be mitigated, hypothetically, by increasing RVU productivity, because as you increase the productivity, you don’t necessarily increase the salary. These findings will be useful when considering bonuses or salary increases.
Payment Analysis
Let’s set up a payment analysis using our practice example.
Take the Total Payments and wRVUs for the practice in 2021- which in the example was $3,221,548.98 for 2021 payments and 34,744.92 for total wRVUs. Calculate the total payments per wRVU for the practice by dividing the payments by the wRVUs. In this example, we ended up with $92.72.
Taking it a step further, we calculated the payments per wRVU per doctor.
Take Dr. Logan:
- Payments 2021 = $690,761.28
- wRVUs = 7,253.61
Calculate Total Payments per wRVU for the practice:
- Payment per wRVU = Payments / wRVUs
- Payment per wRVU = $690,761.28 / 7,253.61
- Payment per wRVU = $95.23
We continued to do this for all doctors and the results are as follows:
- Dr. Dean – $92.67 = $1.07MM / 11,648.11
- Dr. Ashton – $97.79 = $827K / 8,459.23
- Dr. Warren – $85.19 = $629K / 7,383.97
- Dr. Logan – $95.23 = $690K / 7,253.61
Observations
Dr. Warren is receiving the least reimbursements and is significantly below the practice average in payments per wRVU unit.
The administrator may:
- Look to see if there’s a jump in non-contractual adjustments for this provider.
- Dig into the payer mix or case-mix and compare it against the practice’s overall payer mix or patient case-mix. Start with the largest payers and the corresponding reimbursements for this provider.
Dr. Ashton is getting the highest reimbursements per wRVU. He is also below the practice average in cost therefore, Dr. Ashton is one of the most profitable providers based on salaries.
Dr. Dean, however, is in line with the practice average in payments. He is also below practice average in cost therefore, Dr. Dean is also one of the most profitable providers based on salaries.
Using RVUs as a Bonus Comp Plan
With RVUs, you have the availability to drive performance improvements in productivity and profitability.
‘More RVUs = more Productivity = more Revenue = more Profitability.’
You could incentivize providers to properly code or to achieve higher patient volumes, or even use wRVUs for recruiting efforts! Maybe your numbers are telling you that you have a large patient population, but not enough doctors, or perhaps when you hire a new doctor, you can measure their performance by similar already benchmarked wRUVs.
Always remember to keep it simple, understandable, manageable, and attainable. Don’t forget to include the Physicians in the discussions when creating the plan.
Pros of using wRVUs
- wRVUs are a proven, consistent and neutral method of measuring physician performance across specialties.
- Using wRVUs is fair and objective and can be calculated by the providers.
- wRVUs isolate physician’s time, effort, skill and intensity.
- wRVUs are payer neutral so any payer mix discrimination concerns are eliminated.
- Already calculated for the entire spectrum of procedures and readily available.
Cons of using wRUVs
- wRVUs are updated yearly.
- wRVUs need to be accurately calculated and carefully applied per specialty
- wRVUs are subject to “Gaming” just like any other production volume measure.
- Administrators must keep an eye on any significant up-coding and make sure that it is warranted.
- To help mitigate this risk, Physicians should be well aware of coding level benchmarks, how they measure up and most importantly, that the practice is tracking and analyzing any changes in coding levels accordingly.
- Consider that many providers may actually be under-coding and improvements in coding levels may be warranted.
A Simple wRVU Incentive Framework to get you started
Incentive bonus amounts could be 3%, 5% or up to 10% of the total compensation.
First, establish a threshold and set a yearly wRVU target. You can calculate a reasonable and attainable target for Total wRVUs by comparing the provider’s wRVU totals for the prior year against MGMA benchmarking per specialty.
Note that payments are made yearly, but quarterly payments may be offered based on the percentage obtained by counting from the first of the year to the end of the prior quarter. For example, Q1 – 25%, Q2 – 50%, Q3 – 75%, and then Q4 will include the final bonus payment. Quarterly payments are considered advances to be reconciled at year-end.
Lastly, consider setting a ‘stretch goal’, an upper threshold with additional bonus opportunities. Comparatively, Providers that do not reach the established target may receive a smaller percentage of the bonus.
How to use RVU Calculator 2022
Now that you understand the RVU formula and how to calculate RVUs, it’s time to use a reputable RVU calculator like the one from AAPC (American Academy of Professional Coders) to find the total work RVUs for each code. Just like the RVU formula discussed earlier, input your CPT code and the number of units for a total work RVU value.