
Azalea Analytics for Hospitals
Comprehensive Analytics for Hospitals
Azalea’s Hospital Analytics is an industry leading Analytics and Reporting platform leveraging a fully optimized data warehouse. The system can combine and roll-up reporting across any number of hospital or ambulatory business entities.
This video will cover three functional areas to demonstrate how the platform can help your hospital effectively measure, monitor and manage performance across multiple fronts.
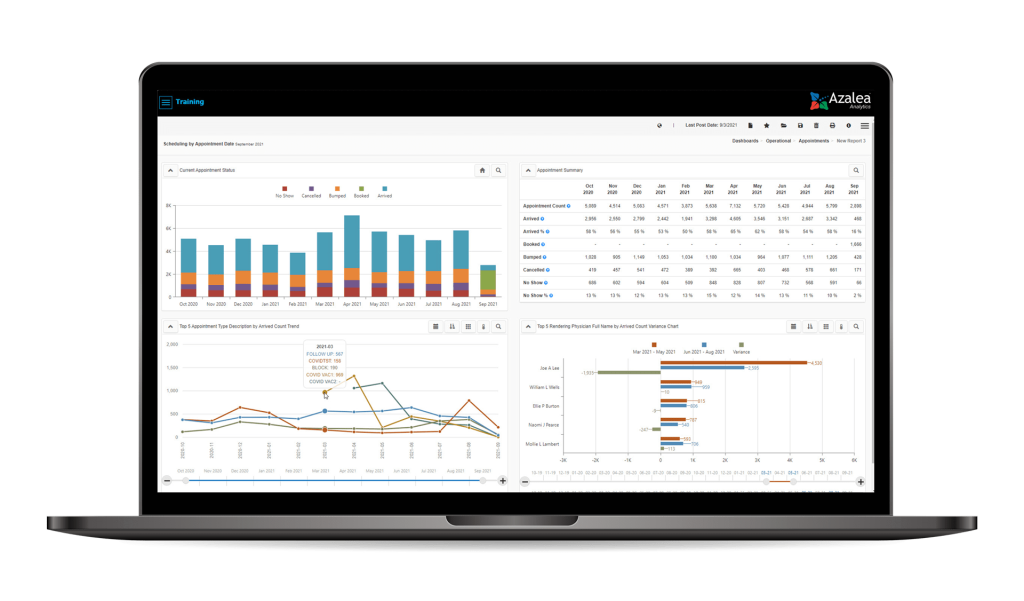
- Interactive Daily Dashboard with Drill Through Analysis
- At a glance KPI’s vs. Goals and Benchmarks with trending and variance analysis charts by Department, Location, Clinician or even Care Level.
- Automated Reports via email
- On the fly reporting via our Ad Hoc Analysis tool
Azalea Hospital Analytics is a very powerful platform that will deliver actionable insights for executives, admins and clinicians as well!
As with all of our Azalea Solutions, we are HITRUST certified, 100% web based and accessible from anywhere with any device.
Contact us today to learn how we can help you drive performance with advanced reporting!
Want to learn more? Watch the hospital analytics demo.
Video Transcript
Executive Scorecard – 00:16
Starting with an executive scorecard, this is a daily dashboard that allows executives and administrators to track performance by looking at key performance indicators, such as number of encounters, assigning a monthly goal, and seeing how we’re performing relative to that goal. You can also track year to date versus prior year to date, and you can look at trending versus your goals and even have upper and lower benchmarks.
Departmental Performance Tracking – 00:46
The system goes a little further than that. You can dive into any one of these measures and track goals per department. In this case, you can see our goals for the emergency room, radiology, labs, med surgery, and so on. In addition, you can trend this information.
Payer Mix Analysis – 1:08
In this case, I’m showing the, payer mix. You can compare time periods, and you can always drill down to detail.
Ad Hoc Analysis – 1:16
The drill down to detail will launch our ad hoc tool where you can create your own charts and graphs as well as tables and go even further and do financial analysis, for example, where you can look at average payments per encounter, payments per patient. You can break this out by financial class. You can break it out, or you can cross reference easily by department.
Slice and Dice Tool – 1:44
The tool lets you slice and dice to your heart’s desire. Here’s a nice example of clinical data where we’re looking at discharge disposition. Maybe we wanna break this out by provider, And I just recently worked with a site that wanted to filter this out for a particular discharge disposition of left without being seen. It’s just that easy.
Prebuilt Reports – 2:14
Finally, we’ve got a ton of prebuilt reports for you to use on day one. Here’s an example of a high level financial summary with ending AR per month, and all of these reports can be set up for automatic delivery using our subscription service. Just choose a format, enter the date selection, perhaps monthly, and then your delivery schedule. Perhaps I decide to send my reports out on the seventh, and quite literally, this report will be sent out to all the, recipients on the seventh like clockwork.
Closing Remarks – 2:59
Well, I hope you enjoyed taking a quick look at our analytics environment. As with everything here at Azalea, we’re high-tech certified, one hundred percent web based, and accessible from anywhere with any device. Contact us anytime to learn more and take a deeper dive of the Azalea hospital analytics.