

Key Takeaways on a Payer Mix Healthcare Analysis
- A payer mix healthcare analysis shows how dependent your revenue is on Medicaid, Medicare, and commercial payers, so you can model risk before it hits your bottom line.
- You can use your EHR to calculate payer mix (visits + payments), then run scenarios to estimate potential Medicaid coverage loss and revenue impact through 2034.
- Rural risk is higher than urban: rural residents rely on Medicaid at higher rates, and rural hospitals depend on Medicaid for roughly 20% of revenue.
- Knowing your payer mix can help you ensure you have enough revenue to cover costs, plan staffing, and update charity care policies if more patients shift to self-pay.
The One Big Beautiful Bill Act (OBBBA) is bringing a lot of changes to Medicaid coverage in the U.S. For rural health clinics and hospitals, an important question is, how will a Medicaid payer mix shift change revenue and uncompensated care?
A good way for rural health clinics and hospitals to prepare for a loss of Medicaid dollars is to run a payer mix healthcare analysis. That analysis lets you see how much of your revenue comes from different payer types, like Medicare, Medicaid, and commercial insurance. When you have visibility into your payer mix, you can understand how shifts in where dollars come from — or don’t — will impact your organization.
Many hospitals, particularly in rural areas, already lose money on Medicare and Medicaid patients and rely on commercial insurance to remain profitable. So even a small loss in Medicaid dollars can further impact the bottom line.
When you see your payer mix, you can target a balanced mix. You ideally don’t want one single payer to make up more than 50% of revenue. A balanced payer mix typically reduces risk and helps avoid over-reliance on a single payer.
Why Knowing Your Medicaid Payer Mix Matters
Provisions in the OBBBA could result in up to 12 million people losing health insurance coverage by 2034.1 (See a timeline of OBBBA’s impacts.) The impacts will mostly affect people who rely on Medicaid and Affordable Care Act (ACA) plans.
In rural areas 23% of residents, or some 2.7 million people, depend on Medicaid coverage.2, 3 And a portion of those 2.7 million rural residents could be without coverage by 2034. Estimates are that rural hospitals rely on Medicaid for roughly 20% of revenues.4
OBBBA impacts won’t take that full 20% of revenues away, but it will potentially impact your financial health and leave patients without coverage who will then potentially become self-pay patients or charity care.
How to Analyze Your Medicaid Payer Mix
To estimate how changes in Medicaid coverage might affect your practice, start by calculating the percentage of:
- Patient visits covered by Medicaid
- Payments/reimbursements that come from Medicaid
This will give you a sense of potential revenue loss and help you plan ahead for any decrease in patient volume.
Your payer mix analysis gives you a baseline for modeling revenue risk and patient volume shifts. And it helps you know if current reimbursements cover your operating costs. You can also see where your margin is coming from (often commercial) versus where volume is coming from (often government payers).
And you can assess financial stability by modeling how changes in payer mix alter revenue, self-pay volume, and charity care needs.
Consider monitoring your mix regularly, not just annually. With visibility into your mix, you can align clinical services with your dominant payers and prioritize select demographics based on payer mix.
How to Pull Medicaid Payer Mix Information
There are a few ways to run reports to find your Medicaid payer mix:
- Running transaction or payer mix reports in most EHR systems
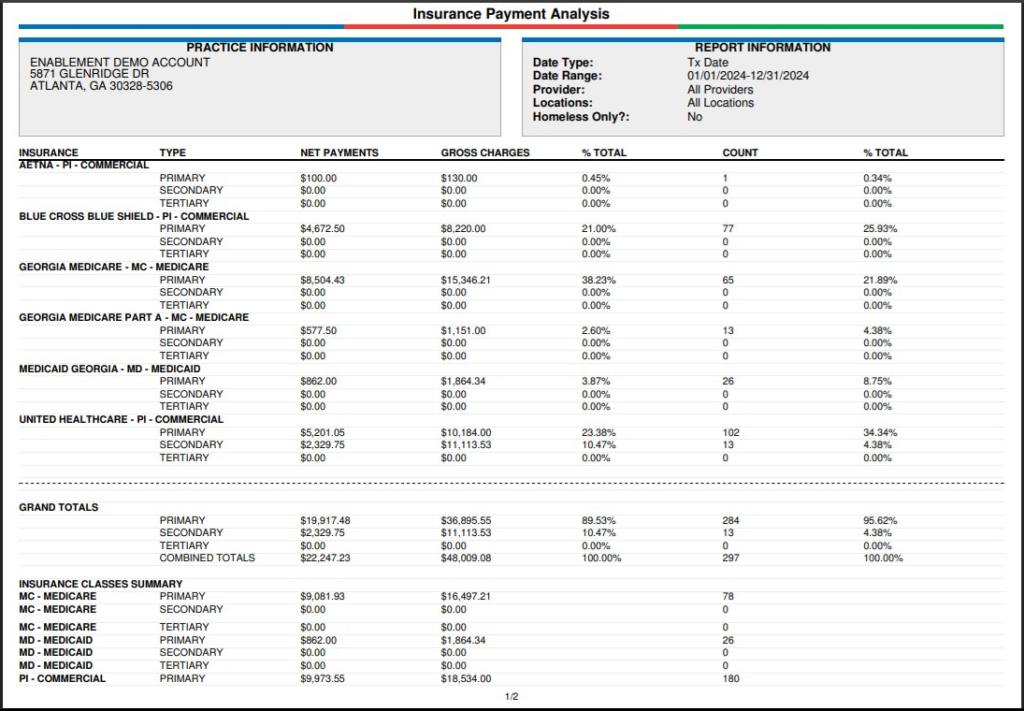
- Using the built-in Insurance Payment Analysis report in Azalea EHR
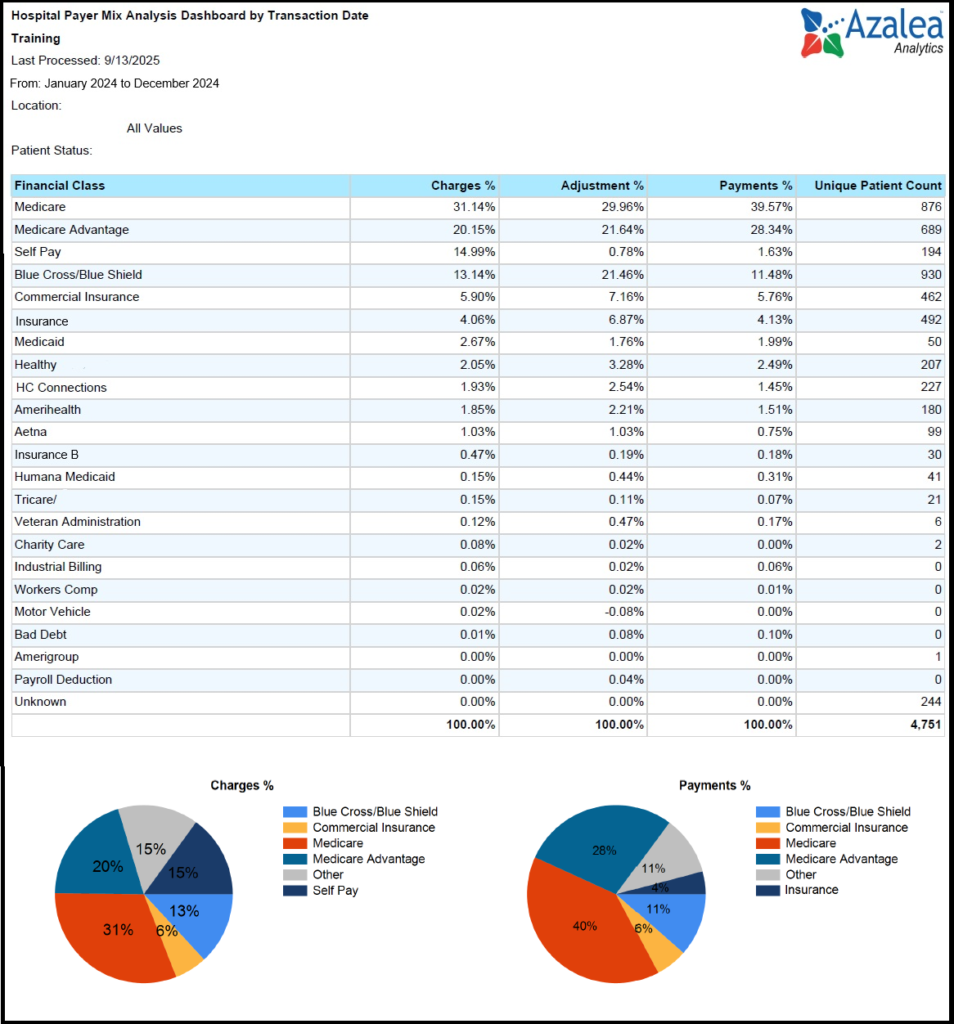
- Using the built-in Payer Mix Analysis Dashboards in Azalea Analytics
How to Do a Manual Payer Mix Healthcare Analysis
Your EHR can give you your Medicaid payer mix, but it won’t show how the OBBBA’s changes to Medicaid coverage could affect your revenue.
To bridge that gap, you can download and use Azalea’s complementary payer mix calculator (an Excel sheet).
Simply enter your Medicaid payer mix data from your EHR, and based on a few assumptions that you can edit, use the calculator to estimate how OBBBA may impact your revenue.
Here’s how to gather your payer mix data and use the payer mix calculator.
- Run your payer mix or transaction reports. If your EHR doesn’t have a payer mix report, run a transaction report broken out by the payer group.
- Track your key data points. Calculate visit volumes, charges, and payments for all the previous year, so you have a full year of data.
- Group your results. Organize the totals into payer categories, such as Medicare, Medicaid, commercial insurance, workers’ comp, and others.
- Determine Medicaid dependence. Calculate what percentage of your total visits and revenue come from just Medicaid. For example, Medicaid might account for 35% of visits but only 25% of revenue, since reimbursements are typically lower than commercial payers.
- Model potential coverage losses. Enter your data into the payer mix calculator. This will give you estimates of how OBBBA’s Medicaid changes could affect your revenue.
In this clip for the Azalea Health Navigating OBBBA and Rural Health Transformation Program, Azalea Health Vice President of Solutions Engineering and Analytics Jose Valero shows how to use the Payer Mix Calculator to model an estimated revenue change to your Medicaid Payer Mix from OBBBA impacts.
Example: Turning Coverage Loss Into Estimated Revenue Impact
If you use the calculator and model a loss of 12% of your Medicaid payer mix patients between today and 2034, and see 1,000 Medicaid patients a year, you’ll see a loss of 120 fewer visits reimbursed by Medicaid. If you multiply 120 by your average revenue per Medicaid visit, you have an estimate of your potential annual revenue losses due to the OBBBA’s impacts on Medicaid.
120 fewer Medicaid visits (1,000 x 0.12)
Every hospital and clinic’s revenue for Medicaid visits is different. But as an example, say your average is $200. At 120 fewer visits, you could be looking at a Medicaid revenue loss of $24,000 annually.
$24,000 estimated annual Medicaid revenue loss (120 × $200)
About Estimating Potential Medicaid Coverage Losses
No one knows or has shared a projected specific percentage of Medicaid recipients who might lose coverage under the Medicaid changes. Different analyses project varying levels of coverage losses.
If potential losses assume a percent of the 78.1 millions people estimated to be on Medicaid in May 2025, it’s possible anywhere from 7% to 15.5% of Medicaid recipients could lose coverage by 2034.5
In the calculator, you might run scenarios at 7%, 11.25%, and 15.5% to get a sense of best-, average, and worst-case possibilities.
How to Find Your Medicaid Payer Mix in Your Azalea EHR
In Azalea Health hospital EHR or ambulatory EHR solutions, you can access your payer mix with the:
- Clinic Statistical report
- Insurance Payment Analysis report
- Payer Mix Analysis Dashboard, if you’re using Azalea Analytics with your Azalea EHR
How to Use Azalea Analytics to Do a Payer Mix Healthcare Analysis
If you’re using Azalea Analytics, you can get your payer mix and deeper analysis of how your payer mix might be shifting over time using the Payer Mix Analysis Dashboards.
When running possibilities in the payer mix calculator, you might put your highest and lowest Medicaid payer mixes over time to see potential best- and worst-case scenarios or find an average in the payer mix calculator.
Other Important Information to Gather
A reduction in the number of patients with Medicaid may have a significant impact on hospitals nationwide, especially rural hospitals. But it won’t be the only impact.
Changes to provider taxes and state directed payments (SDPs) amounts may also impact your Medicaid funding. It’s recommended that you quantify your potential decrease in provider tax/state directed payments (SDPs) amounts, where applicable, between fiscal year 2028 and 2032. Learn more about provider tax and SDP changes in One Big Beautiful Bill Next Steps for Rural Healthcare.
Also look at and track:
- Patient demographics so you understand the age, gender, geographic area and insurance coverage of your payer mix.
- Changes in Medicaid and Medicare enrollment, the number of self-pay patients, and patients covered by commercial insurance so you can anticipate shifts in patient population and adjust services, charity care policies, and outreach as needed.
- Revenue cycle management trends, such as payments, bad debt, and adjust your billing processes to maximize collections from each payer type so you can see ways to reduce charity care and self-pay balances. Hint: You can use a revenue cycle dashboard to make RCM tracking easy.
Next Steps
States have to submit RHT Program applications by November 5, 2025. Be sure to share what you discover about the OBBBA’s impact on your hospital or clinic with your state’s leadership as soon as possible. That way they’ll know the gaps you might experience and be able to include those in their RHTP plan and application.
You may also want to review and update your charity care policy once you determine your payer mix.
For ideas on steps to take to navigate the impacts of the OBBBA, watch the Azalea How to Mitigate OBBBA Impacts webinar.
Sources
1 NASHP, What Health Care Provisions of the One Big Beautiful Bill Act Mean for States, Jul. 8, 2025, https://nashp.org/what-health-care-provisions-of-the-one-big-beautiful-bill-act-mean-for-states/
2 GAO, Why Health Care Is Harder to Access in Rural America, May 16, 2023, https://www.gao.gov/blog/why-health-care-harder-access-rural-america
3 Assuming a rural population of 60 million, 23% of whom rely on Medicaid, which equals 2.7 million people.
4 AFT, How Medicaid cuts threaten rural healthcare, Mar. 28 2025, https://www.aft.org/news/how-medicaid-cuts-threaten-rural-healthcare
5 KFF, Medicaid Enrollment and Unwinding Tracker, Sept. 4, 2025, https://www.kff.org/medicaid/medicaid-enrollment-and-unwinding-tracker